Time Graph
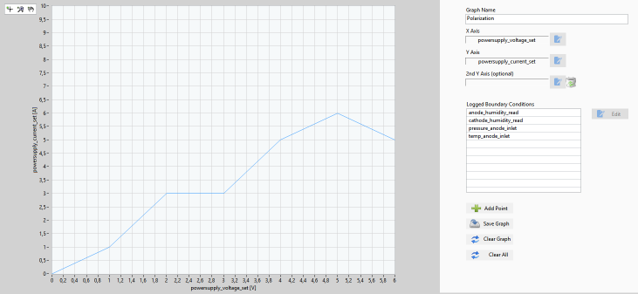
You can easily display the time series of your measurement values. Profiles can be created and the plots can be separated at tow Y Axis.
The graph can be plotted separately on a second screen and there's even a smaller version of the graph for the lower section of the main window.

XY Graph
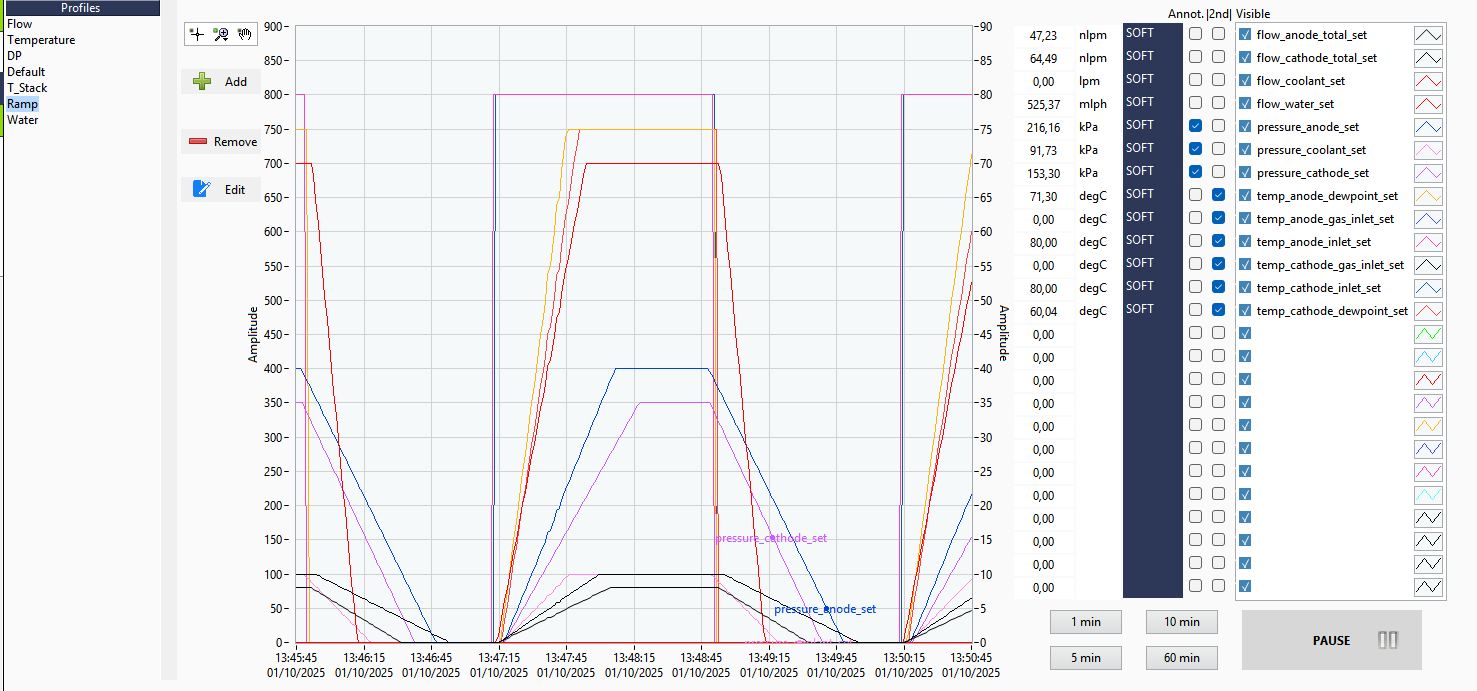
To display for example a polarization curve, a XY graph is offered in ADMIRAL. Two Y-tags can be plotted over a X-tag and up to 10 boundary conditions can be logged as well.